

I have also published delta variant information, a new omicron variant post, and in-depth Covid-19 information.
Since the pandemic began, 1.1% of all permanent Florida residents at least 65 years old have died due to Covid-19, 9.4% of people in that age group who tested positive. Last week, the number of deaths reported to the state declined by 37%. However, the state is claiming only 23% of Covid-19 deaths reported for permanent residents of Florida during the past week as “New Deaths” (28 of 122).
Florida is claiming a 70% vaccination rate. However, only 58% of all permanent Florida residents have at least completed a vaccine series. Eighteen percent have received booster shots, a precaution considered critically important for protecting residents against the omicron variant.
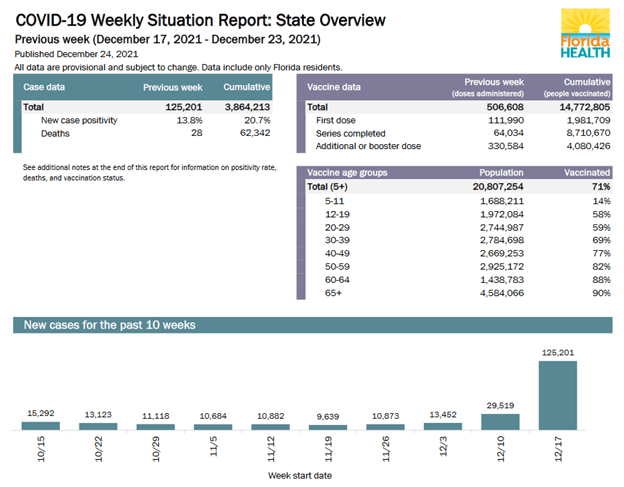
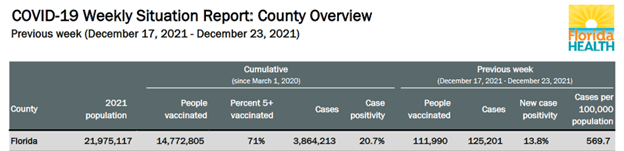
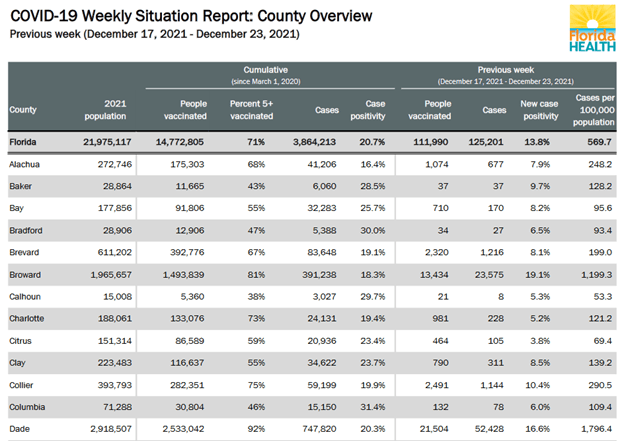
On the December 23rd report, Florida reported 3,864,213 cumulative cases. Of those, 125,201 were reported as new, a 323% increase from the prior week (29,568). Compared to when the omicron variant was first detected, during the week of December 3–10, Florida has experienced an increase in new cases of 831%. On December 23rd, Florida reported 26,811 cases to the CDC. Since then, the state has reported a new record in the number of daily cases.
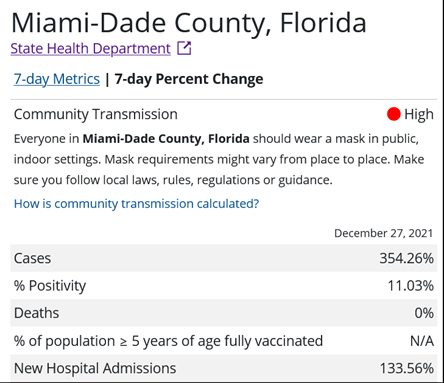
The first cases of the omicron variant were detected at a VA hospital in Tampa and in Miami. On December 2nd, 99% of the samples sequenced in Miami-Dade County were the delta variant. A week later, 80% were omicron. Despite having the highest percentage of people in the state at least partially vaccinated, there has been a 354% increase in cases there over the past seven days. This is one week after they experienced a 334% rise in cases. Almost 2% of the population tested positive last week; however, a positivity rate of 24% indicates the percentage of those infected is closer to 10%.
Throughout the course of the pandemic, 9% of all hospitalizations in the US have been within Florida. After declining for several months, the state had a concerning 80% rise in hospital admissions in the past week (370/day). All age groups were more likely to require hospital care, with the largest jump in the 18–29 age bracket. Among adults in Florida, they are the least likely to be vaccinated.
Pediatric hospitalizations rose 88%. Changes in the school masking and quarantine policies enacted by the new FL Surgeon General on September 22, 2021, may account for the discrepancy in adult vs. pediatric hospitalization state rankings (49th for adults; 28th for children).
Between April 1st and December 23rd of this year—when vaccinations were available to all Floridians over the age of 16—11.0% of all Covid-19 deaths have occurred in Florida, a state with 6.6% of the population. Since the pandemic began, the state has the ninth worst Covid death rate in the nation.
Florida is the only state in the US which is releasing statistics on a weekly basis. Information available in those reports is far more limited than what the state formerly provided.
Since October 14, 2021, I have made many attempts to access the FL Dept of Health Weekly Report. However, my browser will not download it due to a potential security risk. Note what the agency is choosing to publicize on Twitter during this crisis:

TBT: Why Doesn‘t Florida Trust Its Residents with Basic COVID Information?
On October 18th, I followed the Dept of Health’s recommendation to contact their COVID Data Analytics section, then went outside. When I returned, I had to do a major recovery process following an unauthorized attempt to access my hard drive. I still have not received a response from the FL COVID Data Analytics group. Even the main site for the Florida Dept of Health appears on an unsecure connection: www.floridahealth.gov.
Meanwhile faculty at the University of Florida charge that they have felt external pressure from the highest levels of state government to delete data related to their Covid research. They also encountered “barriers to accessing and analyzing” data and “barriers to publication of scientific research which inhibited the ability of faculty to contribute scientific findings during a world-wide pandemic.”
I’m now accessing the pdf for the weekly summary via Dr. Jason Salemi’s site:
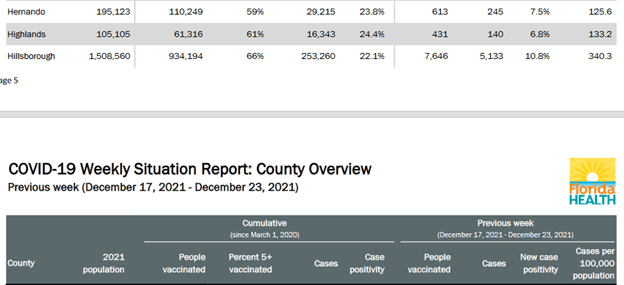
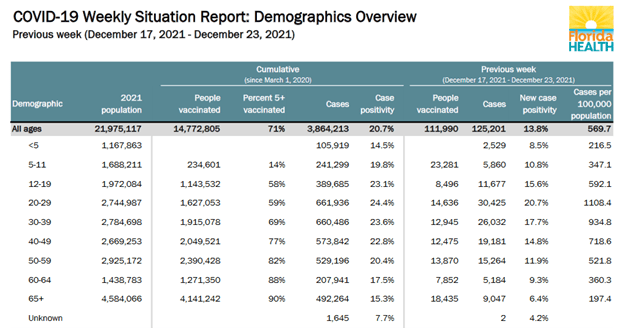
Here is some of the data from December 17–23, 2021:
- New cases = 125,201; Cumulative cases = 3,864,213
- New deaths = 28; Cumulative deaths = 62,342
- Vaccination rate = 71%
- Fully vaccinated people minus those with booster shots = 8,710,670
- Total booster doses: 4,080,426
Salemi USF: COVID-19 in Florida
The vaccination rate reported by the state rose one percentage point to 71%. This figure represents only those eligible for vaccination and includes partially vaccinated people. Florida’s population is currently 21,975,117, so 58% have at least completed a vaccination series. People who receive a booster shot are removed from the Series Completed Category and added to the Additional Dose Category. Eighteen percent of Floridians have received a booster shot, a dose considered extremely important for providing protection against the omicron variant. Since I created this chart, researchers have discovered that booster efficacy begins to wane at ten weeks:


Salemi USF: COVID-19 in Florida
Note that archived data on influenza statistics is readily available on the FL Dept of Health web site: Florida Influenza Surveillance Reports 2003–2021
This data from December 10–16, 2021, came from Dr. Salemi’s archives. Since October 14th, my browser will not download the FL Dept of Health Weekly Report, citing it as a security risk. Nevertheless, you would not find any archived Covid information on the FL Dept of Health site:
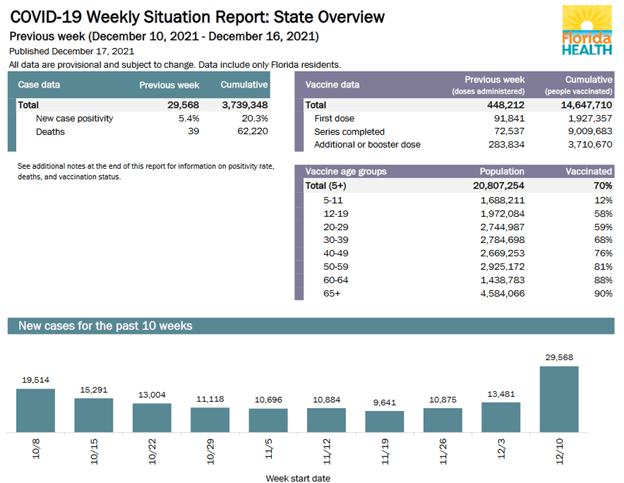
- New cases = 29,568; Cumulative cases = 3,739,348
- New deaths = 39; Cumulative deaths = 62,220
- Vaccination rate = 70%
- Fully vaccinated people minus those with booster shots = 9,009,683
- Total booster doses: 3,710,670
Salemi USF: COVID-19 in Florida
December 16, 2021 Florida Statistics: What Is Really Happening?
.
Covid Deaths in Florida:
Despite making national news for the state government’s attempt to cover up the number of deaths, nothing has changed in the Florida Department of Health’s methodology.
The Hill: Florida Reported ‘Artificial Decline’ in COVID-19 Deaths as Cases Were Surging
Subtracting the December 23rd New Deaths from the Cumulative Deaths should give us the number of December 16th Cumulative Deaths. However, doing that reveals 94 deaths which were not included in the December 23rd New Deaths. There was a total of 122 deaths reported in Florida during that week. Yet only 23% of deaths (28) are reflected clearly on the December 23rd report. This is a 37% decrease from last week (194).
Salemi USF: COVID-19 in Florida
December 16, 2021 Florida Statistics: What Is Really Happening?
When the state receives a report of a death from a previous week, that information is added to “Cumulative Deaths” without being noted in “Previous Week Deaths.” It usually takes more than one week for death reports to get sent to the state.
Unless someone knows to compare the two data sets from both weeks, that is not apparent. By removing data from December 16th and adding data from December 23rd simultaneously, only people who have saved the older data can see what they are doing. It looks like the death rate is 77% better than it is.
Florida Politics: Florida Reports 1000+ Covid-19 Deaths in Past Week
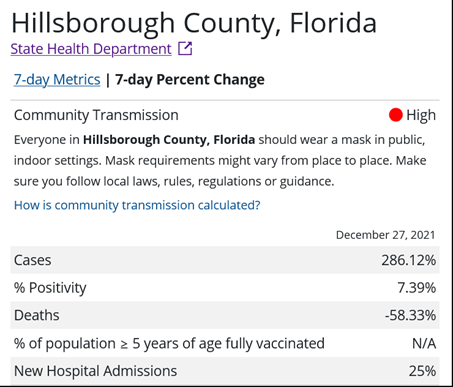
By comparing the decrease in this week’s deaths to the 12 which occurred during December 11–17, 2021, I calculated that Hillsborough County had 7 deaths reported to the CDC during December 20–27th. Due to the Christmas holiday, data was unavailable for the 17th–23rd. However, the case numbers are very close to what is in the state report:

CDC: Integrated County View, Hillsborough FL
On June 4th, the state removed all data from anyone who has not established permanent residency and stopped reporting information from visitors, seasonal residents, and migrant workers. This deleted 744 deaths. I can no longer access this file, as my browser deems it a security risk:
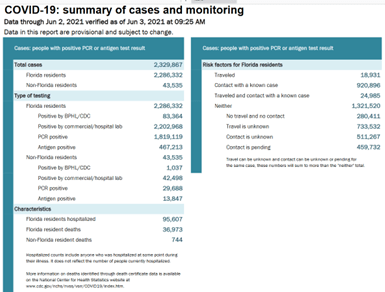
FL Covid-19 Cases and Monitoring as of June 3, 2021
Since August 1st, 21,849 permanent residents of Florida have died from Covid-19. All FL residents at least sixteen years old became eligible for vaccination on April 1st. SARS-CoV-2 infections have killed 27,867 permanent residents of the state since that date to December 23rd. Despite having only 6.6% of the US population, this represents 11.0% of all American Covid-19 deaths since everyone at least 16 years old qualified for vaccination.
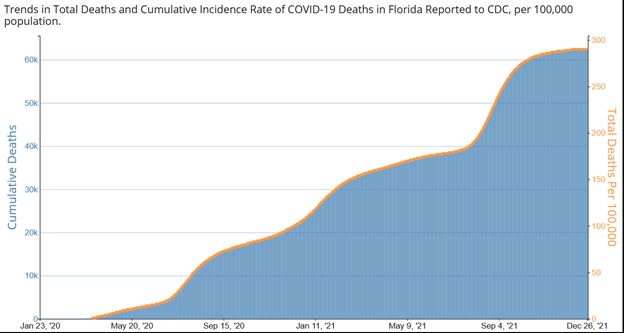
Trends in Number of COVID-19 Cases and Deaths in the US Reported to CDC, by State
Since the pandemic began, 1.1% of all permanent Florida residents at least 65 years old have died due to Covid-19 (1014/100,000). That is 9.4% of people in that age group who tested positive. Nationwide, 9.9% of senior citizens who have tested positive have died:
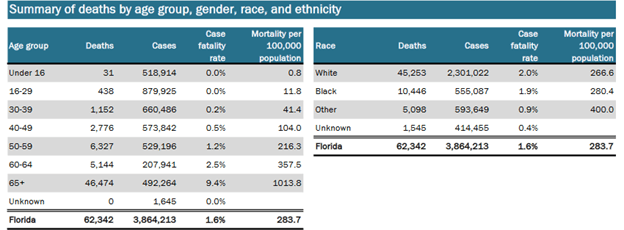
Salemi USF: COVID-19 in Florida
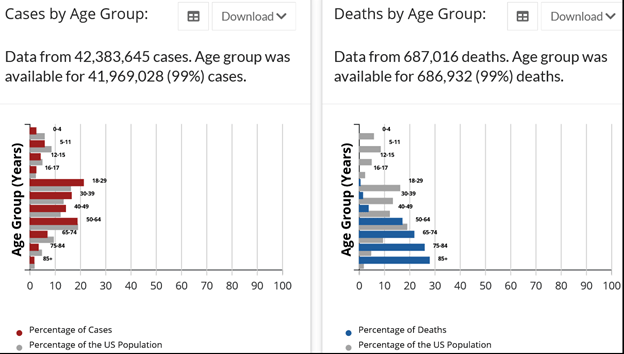
CDC: Demographic Trends of COVID-19 Cases and Deaths in the US Reported to CDC
The CDC recently updated their algorithm for calculating excess deaths in the US to include six years of data, rather than four, due to the pandemic skewing the expected numbers. Here is that information for Florida. You can click on each bar on their site to see the data for that week. It takes up to eight weeks for complete reporting:
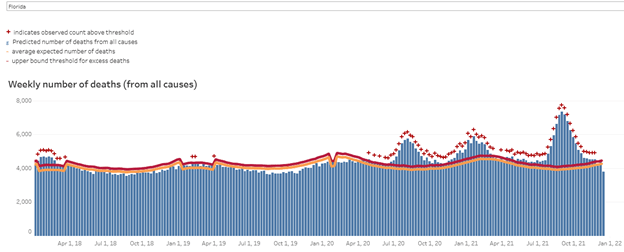
CDC: Excess Deaths Associated with COVID-19
Florida has a higher than expected proportion of excess deaths compared to other states. This is the total number of excess deaths throughout the pandemic, not the number per 100,000 people:
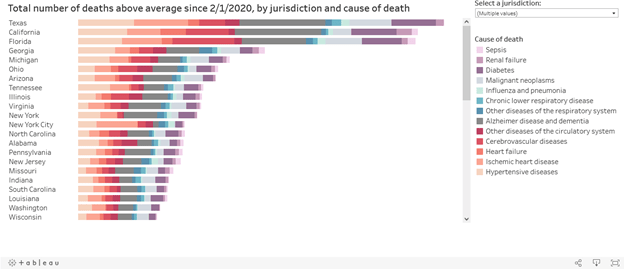
DC: Excess Deaths Associated with COVID-19 by Jurisdiction/Cause
This week, Florida has improved from the deepest shade of blue for the first time since I began downloading this graphic. We still have the highest proportion of Covid deaths among the six largest states: CA (190); TX (255); FL (290); NY (209); PA (279); IL (240). Florida has the ninth worst death rate in the nation:
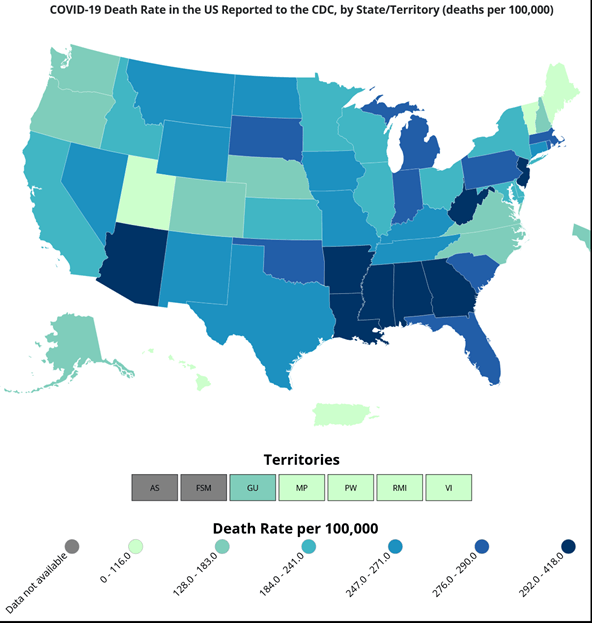
CDC: United States COVID-19 Cases, Deaths, and Laboratory Testing by State and Territory
.
Covid Cases in Florida:
On the December 23rd report, Florida reported 3,864,213 cumulative cases. Of those, 125,201 were reported as new, a 323% increase from the prior week (29,568). Subtracting the new number from the cumulative one should give us the cumulative number from the prior week: 3,739,012.
However, the December 16th report shows a cumulative number of 3,739,348. This week, the state is underreporting 336 cases, 0.3% of the total. I have no idea why this discrepancy exists, although it is much more accurate than usual. There were really 125,535 cases reported last week, a 324% increase from a week ago.
Compared to when the omicron variant was first detected, during the week of December 3–10, Florida has experienced an increase in new cases of 831%.
On December 23rd alone, Florida reported 26,811 cases to the CDC [That record has since been shattered].
Salemi USF: COVID-19 in Florida
December 16, 2021 Florida Statistics: What Is Really Happening?
ABC News: Omicron Makes Up 80% of Cases in Miami-Dade
Local10: Florida Nears COVID Record with 26,000+ New Cases in One Day
The Hill: Florida Breaks Another Record for COVID-19 Cases
Miami-Dade County was one of the first places in the state to detect the omicron variant. On December 16th, 80% of samples sequenced there were the omicron variant. Only two weeks before, 99% had been the delta variant. Look at what has happened there in the past seven days:
- Over 52,400 cases despite 85% of the eligible population being fully vaccinated. Last week, there were about 11,500 cases. This is an increase of over 350%.
- Almost 2% of the population tested positive
- A 24% positivity rate, meaning the actual number of cases is likely 4.8 times higher. This is double the rate from last week
- 134% more hospitalizations than a week ago, when the rate had risen by 60%.
- The same number of deaths as a week ago. Last week, there was a rise of 24%.
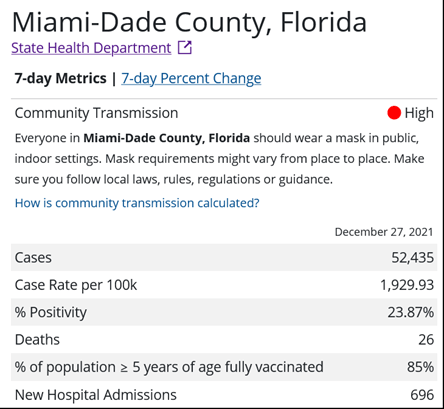
CDC: Integrated County View, Miami-Dade FL
ABC News: Omicron Makes Up 80% of Cases in Miami-Dade
Salemi USF: COVID-19 in Florida
On June 4th, the state removed all data from anyone who is not a permanent resident and stopped reporting it. This deleted 43,535 cases.
FL Covid-19 Cases and Monitoring as of June 3, 2021
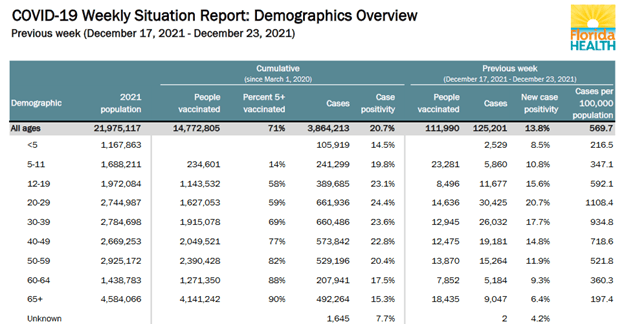
During the week of December 17–23, 8,389 children under twelve tested positive in Florida, an increase of 286% over the previous week (2,173). Among those 12–19, 11,677 tested positive, 396% more than the prior week (2,356). In total, 20,066 Florida residents under the age of twenty tested positive, an increase of 343% from the previous week (4,529).
The CDC recommended vaccination for children aged 5–11 on November 2nd. Until two weeks ago, they had the highest positivity rate in Florida. That has shifted to adolescents and adults under 50. Booster shots are approved for anyone at least 16 years old who had a second shot of an mRNA vaccine over six months ago or got the Johnson & Johnson vaccine two months ago.
Salemi USF: COVID-19 in Florida
December 16, 2021 Florida Statistics: What Is Really Happening?
In the Hillsborough County School District, as of December 17th there have been 12,279 cases during this school year. The 215 cases reported during December 10–17 constitute a 117% increase from the prior week (99). Forty-two cases were added on the last day of the semester, December 17th. This school year began on August 10th, and the district instituted a mandatory mask mandate on August 18th. They ended it on October 15th. Florida law now leaves the decision about quarantining after a close contact at school to the child’s parents.
HCSD: Covid FrequentlyAsked Questions
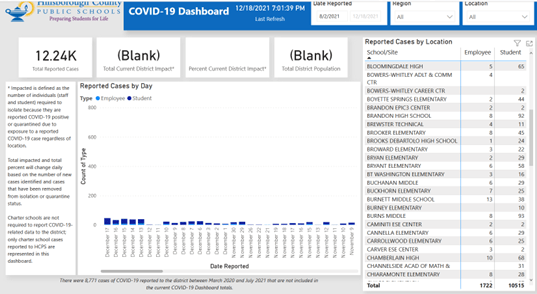
My daughters’ high school has had 70 cases, with none in the past fourteen weeks. During August 28th–September 2nd, the increase from the prior week was 87%. Our elementary school has had 64 cases.
Hillsborough County Public Schools Covid Dashboard
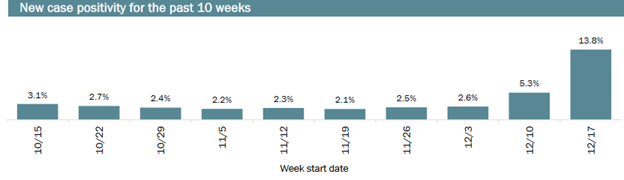
Here are a few of the FL Dept of Health county positivity rates. Hillsborough County rose from 4.3% to 10.8%. The state average rose 160% in one week, from 5.4% to 13.8%. We cannot tell from this that the number of cases in Hillsborough County rose 276% in the past week (from 1,363):
Salemi USF: COVID-19 in Florida
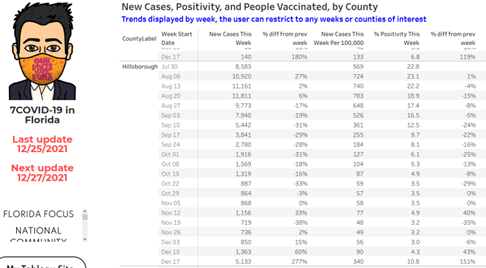
Dr. Jason Salemi, a professor from the University of South Florida, has been compiling data from the state since May 28th. His county-level data are quite helpful. Note that this runs one week late. It indicates that Hillsborough County rose from 90 cases per 100,000 people to 340 during December 11–17, 2021. On his site, you can click on the maps for detailed information on each county:
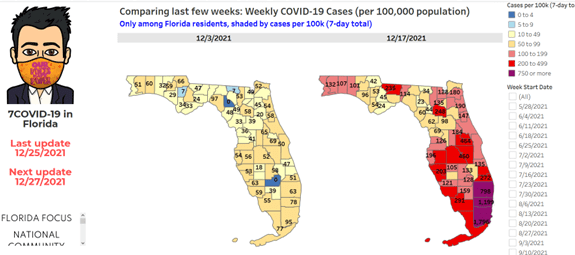
He also lists the data for each week since May 28, 2021, when Florida deleted its daily dashboard. I have excluded some weeks to fit the most recent date into the screenshot. The 151% increase in Hillsborough County cases is evident here:
Salemi USF: COVID-19 in Florida
The CDC notes 5,147 new cases in Hillsborough County in the week prior to December 27th: Due to the Christmas holiday, this is very close to the state’s report for December 17–23:
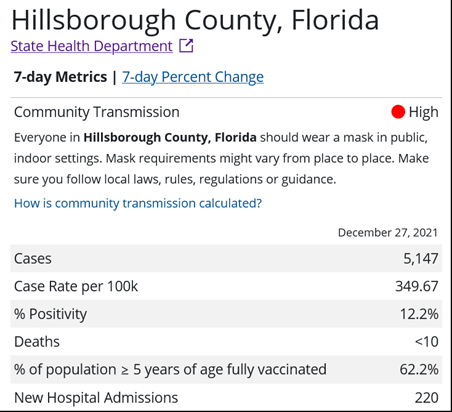
That represents an increase of 286%, with a high level of transmission:

CDC: COVID-19 Integrated County View, Hillsborough County FL
Covid Hospitalizations in Florida:
You won’t find any hospitalization information on Florida’s Weekly Surveillance Reports. Florida stopped reporting Covid hospitalizations on June 24, 2021. However, Florida must relay all hospitalization data to the US Department of Health and Human Services (HHS).
Florida reported a record 13,028 hospitalizations for Covid-19 on August 24, 2021, to the US Department of Health and Human Services.
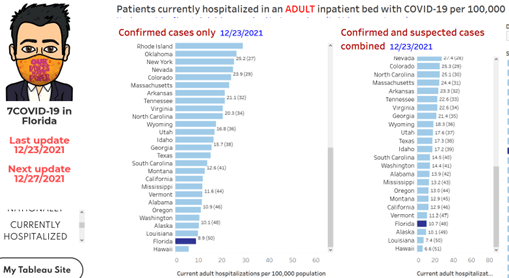
Fourteen weeks ago, Florida had the highest adult hospitalization rate in the US. Over the past six weeks, Florida has remained the second best (from 6.6 to 8.9/100,000) [By December 27th, Florida rose to 42nd with 11.6/100,000]:
Florida’s pediatric hospitalization rate rose from 33rd worst on December 17th to 28th worst on December 23rd (from 0.56 to 0.99/100,000) [24th at 1.32/100,000 on December 27th]:
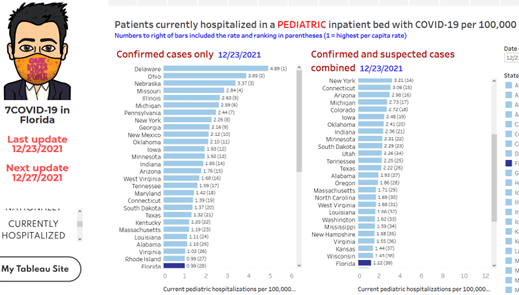
Changes in the school masking and quarantine policies enacted by the new FL Surgeon General on September 22, 2021, may account for the discrepancy in adult vs. pediatric hospitalization rankings. This makes it harder for counties to enforce mandatory mask wearing and allows the parents of children exposed to SARS-CoV-2 to determine whether their children should quarantine or return to school.
Salemi USF: COVID-19 Currently Hospitalized in Florida
TBT 9-30-21: Florida’s School Mask, Quarantine Rules Draw More Criticism
For August 1, 2020–December 23, 2021, Florida has had 322,956 new admissions for Covid patients. This represents 9.0% of all Covid admissions in the US for 6.6% of the US population:
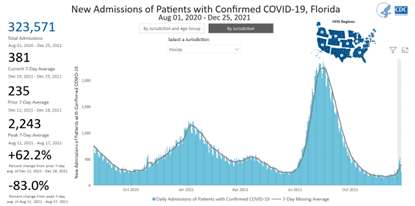
You can also find hospitalization statistics on the same CDC COVID Data Tracker, choosing Florida as the Jurisdiction and stratifying by any age:
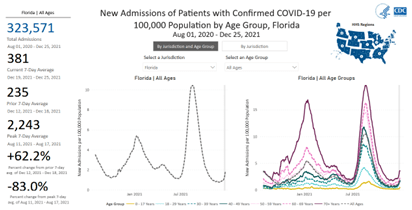
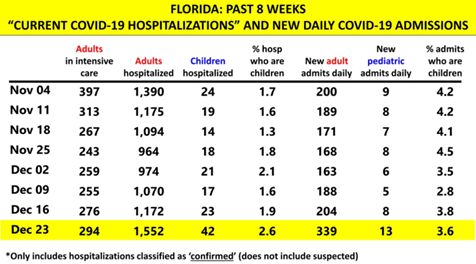
For December 17th–23rd, there was an average of 370 admissions per day. This is an increase of 80% from the previous week (205) and a decrease of 83% from the peak during August 11–17, when there were 10.42 admissions/100,000 Floridians.
The number of admissions increased as the week progressed; by the end of the week, daily admissions had doubled. Hospitalizations increased for every age group ranging from 43% for ages 40–49 and 60–69 to 257% for the 18–29 age bracket. Among adults in Florida, people aged 18–29 are the least likely to be vaccinated. Pediatric hospitalizations rose 88%.
On December 23rd, there were 1.74 new admissions/100,000 Floridians; 0.96 the week before:
| Age | Admissions |
| 0–17 | 0.32 |
| 18–29 | 1.71 |
| 30–39 | 1.61 |
| 40–49 | 1.56 |
| 50–59 | 1.66 |
| 60–69 | 2.08 |
| 70+ | 3.46 |
| all ages | 1.74 |
December 16, 2021 Florida Statistics: What Is Really Happening?
Salemi USF: COVID-19 in Florida
The number of people in the hospital was steadily dropping until four weeks ago. Since then, the number of adult admissions has risen by 61% [There was a continued rise to 2,026 on December 27th; 508/day]. Pediatric admissions are 83% higher than last week [56 in hospital with 26 admissions/day on December 27th]. One-fifth of hospitalized adults are in the ICU (19%, a 4% drop from a week ago):
Salemi USF: COVID-19 in Florida Hospital Admissions by Age
HHS tracks Hospital Utilization. On December 23, 2021, 75% of hospital beds in Florida were full, down 4% from last week. Covid patients accounted for 4% of utilized beds, up by 1%. Last week, there were 1,492 hospitalized Covid patients, making this an increase of 47%.
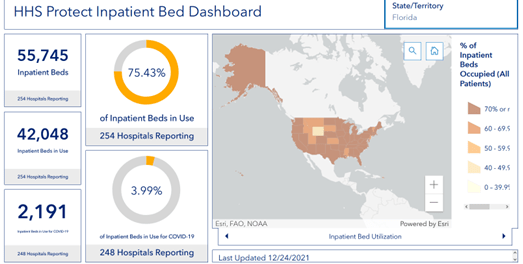
Five percent of ICU beds in use in Florida were occupied by 317 Covid patients, 13% more than the previous week (281):

HHS: Inpatient Bed Utilization by State
December 16, 2021 Florida Statistics: What Is Really Happening?
Many hospitals are publishing their own occupancy statistics. For example, Tampa General Hospital released this on December 24th:
- There were 29 Covid-19 admissions, up from 19 a week before [42 on December 27]
- Nine Covid patients were in their ICU, two more than a week before (7)
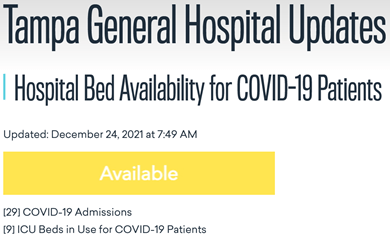
Tampa General : Hospital Bed Availability for COVID-19 Patients
December 16, 2021 Florida Statistics: What Is Really Happening?
Archived posts on Florida Covid statistics are available here
