
I have also published delta variant information and in-depth Covid-19 information.
Florida is the only state in the US which is releasing statistics on a weekly, not daily, basis. Let’s look at these two charts from the Florida Department of Health.
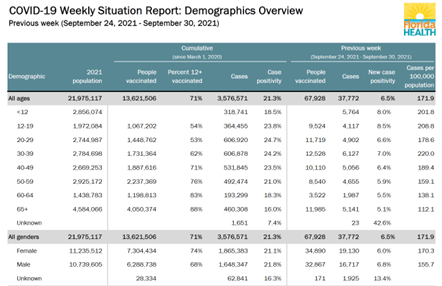
Here is some of the data from September 24–30, 2021:
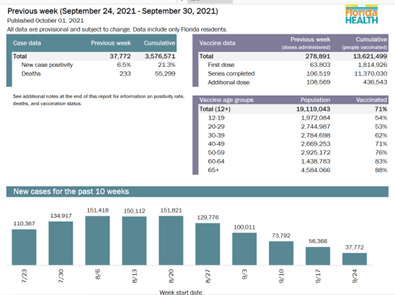
- New cases = 37,772; Cumulative cases = 3,576,571
- New deaths = 233; Cumulative deaths = 55,299
- Vaccination rate = 71%
- Fully vaccinated people = 11,370,030
- Roughly 600,000 confirmed cases of Covid-19 in August.
The vaccination rate of 71% represents only those who are eligible for vaccination and includes partially vaccinated people. Florida’s population is currently 21,975,117. That makes the actual full vaccination percentage = 51.7%.
Florida Covid-19 Weekly Situation Report: September 24–30
Note that archived data on influenza statistics is readily available on the FL Dept of Health web site: Florida Influenza Surveillance Reports 2003–2021
The chart for September 17–23, 2021 is from a screenshot because Florida is immediately removing all traces of older Covid data when the new data is put online:
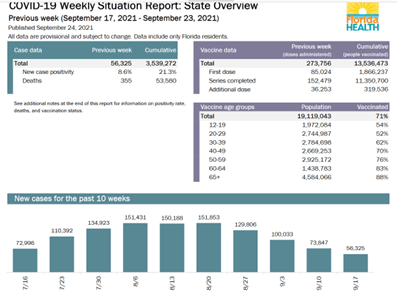
- New cases = 56,325; Cumulative cases = 3,539,272
- New deaths = 355; Cumulative deaths = 53,580
- Vaccination rate = 70%
- Fully vaccinated people = 11,208,873
- Roughly 600,000 confirmed cases of Covid-19 in August.
September 22, 2021 Florida Statistics: What is Really Happening?
Covid Deaths in Florida:
Despite making national news for the state government’s attempt to cover up the number of deaths, nothing has changed in the Florida Department of Health’s methodology.
The Hill: Florida Reported ‘Artificial Decline’ in COVID-19 Deaths as Cases Were Surging
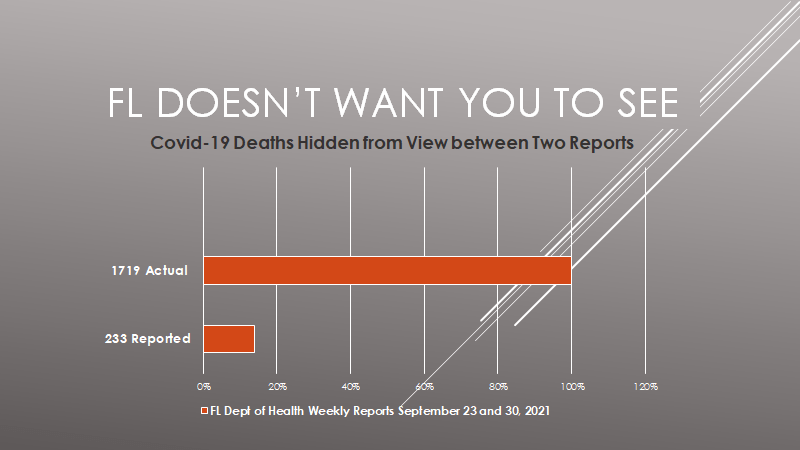
Subtracting the September 30th new deaths from the cumulative deaths should give us the number of September 23rd cumulative deaths. However, doing that reveals 1,486 deaths which were not included in the September 30th data. There was a total of 1,719 deaths reported in Florida during that week. Yet only 13.6% of deaths (233) are reflected clearly on the September 30th report. Sadly, I know one of the people who likely falls into that hidden category.
Florida Covid-19 Weekly Situation Report: September 24–30
This is a 36% decrease from last week (2,340). Since August 1st, 14,558 permanent residents of Florida have died from Covid-19:
September 22, 2021 Florida Statistics: What is Really Happening?
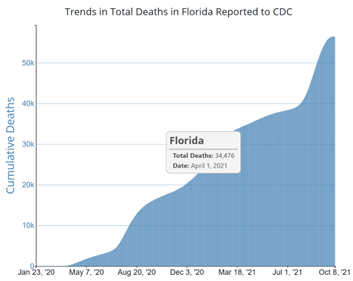
Trends in Number of COVID-19 Cases and Deaths in the US Reported to CDC, by State
When the state receives a report of a death from a previous week, that information is added to “Cumulative Deaths” without being noted in “Previous Week Deaths.” It usually takes more than one week for death reports to get sent to the state.
Unless someone knows to compare the two data sets from both weeks, that is not apparent. By removing data from September 23rd and adding data from September 30th simultaneously, only people who have saved the older data can see what they are doing. It looks like the death rate is 86% better than it is.
Florida Politics: Florida Reports 1000+ Covid-19 Deaths in Past Week
On June 4th, the state removed all data from anyone who has not established permanent residency and stopped reporting information from visitors, seasonal residents, and migrant workers. This deleted 744 deaths:
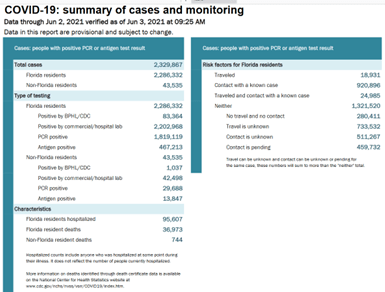
FL Covid-19 Cases and Monitoring as of June 3, 2021
Covid Cases in Florida:
On the September 30th report, Florida reported 3,576,571 cumulative cases. Of those, 37,772 were new, a 33% improvement from the prior week (56,325). Subtracting the new number from the cumulative one should give us the cumulative number from the previous week: 3,538,799.
However, the September 23rd report shows a cumulative number of 3,539,272, a discrepancy of 473 extra cases (1.2%). Why that difference exists remains unclear.
On June 4th, the state removed all data from anyone who is not a permanent resident and stopped reporting it. This deleted 43,535 cases.
FL Covid-19 Cases and Monitoring as of June 3, 2021
The state is now reporting the number of cases in children under twelve:
Florida Covid-19 Weekly Situation Report: September 24–30
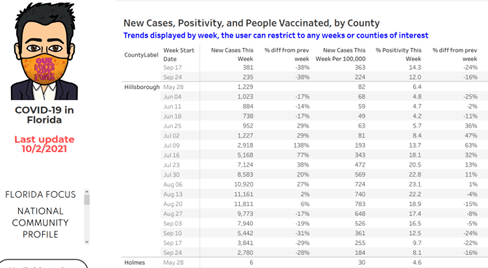
A professor from the University of South Florida has been compiling data from the state since May 28th. Here is what he has posted about pediatric cases since then until September 24th. I have omitted the earlier weeks to fit the data into one screenshot:
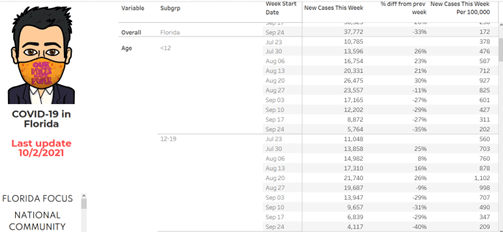
During the week of September 17–September 17, 5,764 children under twelve tested positive in Florida, a decrease of 35% over the previous week. Among those 12–19, 4,117 tested positive, a decrease of 40%. In total, 9,881 Florida residents under the age of twenty tested positive.
Salemi USF: COVID-19 in Florida
In the Hillsborough County School District, 5% of the 11,090 cases have occurred in the past week. Four weeks ago, the rate of increase was 87%. The school year began on August 10th, and the district instituted a mandatory mask mandate on August 18th.
My daughters’ high school has had 70 cases, with none in the past two weeks. During August 28th–September 2nd, the increase from the prior week was 87%. Our elementary school has had 59 cases, an increase of 5% in the past week. That rate of increase dropped by 7%.
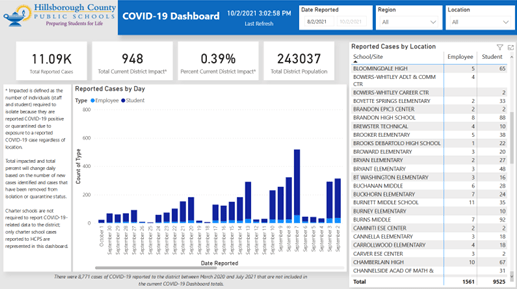
Hillsborough County Public Schools Covid Dashboard
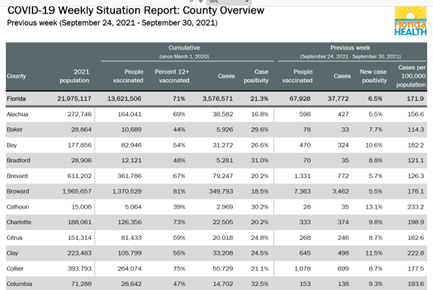
Look at the difference in ease of use between the Dept of Health’s county positivity rates:

Florida Covid-19 Weekly Situation Report: September 24–30
and Jason Salemi’s:
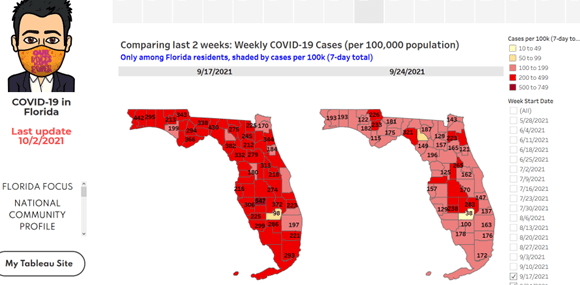
You can click on the maps for detailed information on each county. He also lists the data for each week since May 28, 2021, when Florida deleted its daily dashboard.
Salemi USF: COVID-19 in Florida
Covid Hospitalizations in Florida:
You won’t find any hospitalization information on Florida’s Weekly Surveillance Reports. Florida stopped reporting Covid hospitalization June 24, 2021. However, Florida must relay all hospitalization data to the US Department of Health and Human Services (HHS).
Florida reported a record 13,028 hospitalizations for Covid-19 on August 24, 2021 to the US Department of Health and Human Services.
Four weeks ago, Florida had the highest adult hospitalization rate in the US. Over the past week, Florida improved from the fourteenth worst hospitalization rate for adults in the nation to twenty-second worst (from 38.8 to 27.8/100,000).

Florida dropped from fourteenth worst for children to the twenty-first in the past week (2.55 to 2.03/100,000):

Salemi USF: COVID-19 Currently Hospitalized in Florida
You can also find statistics on the CDC’s COVID Data Tracker, choosing Florida as the Jurisdiction and stratifying by any age:

For August 1, 2020–September 30, 2021, Florida had 300,946 new admissions for Covid patients. This represents 10% of all Covid hospitalizations in the US. The daily average over the past seven days was 850 new admissions (a decrease of 24% in the past week and of 71% from the peak during August 11–17). Every age group declined.
On September 30th, there were 2.99 new admissions/100,000 Floridians:
| Age | Admissions |
| 0–17 | 0.60 |
| 18–29 | 1.24 |
| 30–39 | 2.09 |
| 40–49 | 2.78 |
| 50–59 | 3.27 |
| 60–69 | 4.24 |
| 70+ | 6.70 |
| all ages | 2.99 |
The number of people in the hospital is now steadily dropping:

Salemi USF: COVID-19 in Florida Hospital Admissions by Age
HHS tracks Hospital Utilization. Searching by facility does not include the number of Covid-19 patients. However, after scrolling down to Inpatient Bed Utilization by State, you can choose Florida. On October 2nd, 2021, 79% of hospital beds in Florida were full. The 5,216 Covid patients accounted for 9% of utilized beds, an improvement of 3%.
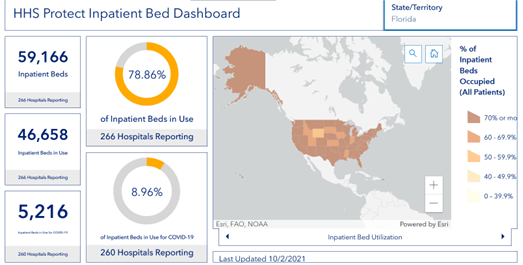
Twenty-one percent of ICU beds in use in Florida are occupied by 1,358 Covid patients. That is down from 29% the previous week. State-wide, 82% of ICU beds are occupied:
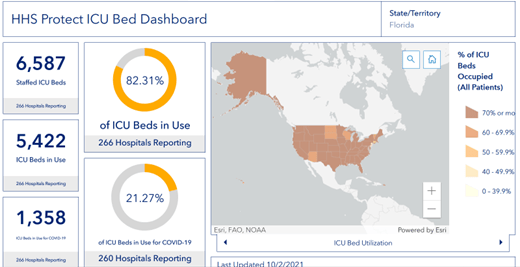
HHS: Inpatient Bed Utilization by State
Many hospitals are publishing their own occupancy statistics. For example, Tampa General Hospital released this on October 2nd:
- There were 60 Covid-19 admissions, down from 107 one week before
- 23 Covid patients were in their ICU, down from 42 one week before
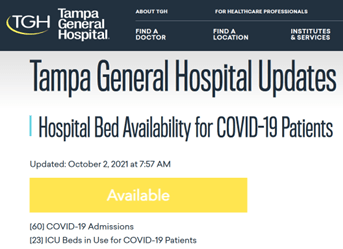
Tampa General : Hospital Bed Availability for COVID-19 Patients
In Florida, the number of deaths, cases, and hospitalizations due to Covid-19 are all declining significantly. Throughout the course of the pandemic, 10% of all hospitalizations in the US have been within the state. Between August 1st and September 30th of this year, 18% of all Covid-19 deaths have occurred in Florida.
.
Archived posts on Florida Covid statistics are available here:
