
I have also published delta variant information and in-depth Covid-19 information.
.
Florida is the only state in the US which is releasing statistics on a weekly, not daily, basis. Information available in those reports is far more limited than what the state formerly provided.
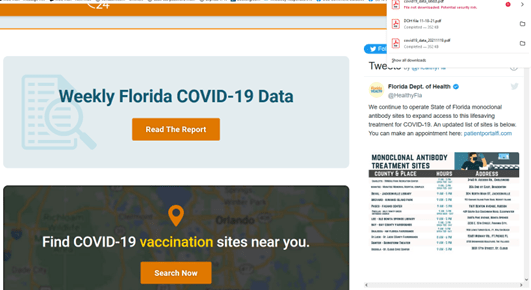
Since October 14, 2021, I have made multiple attempts to access the FL Dept of Health Weekly Report and my browser will not download it due to a potential security risk:
TBT: Why Doesn‘t Florida Trust Its Residents with Basic COVID Information?
On October 18th, I followed the Dept of Health’s recommendation to contact their COVID Data Analytics section, then went outside. When I returned, I had to do a major recovery process following an unauthorized attempt to access my hard drive. While I’m not sure the events are related, I had to rely upon the Tampa Bay Times on October 17th for that week’s report. I still have not received a response from the FL COVID Data Analytics group. Even the main site for the Florida Dept of Health appears on an unsecure connection: www.floridahealth.gov
I’m now accessing the pdf for the weekly summary via Dr. Jason Salemi’s site:
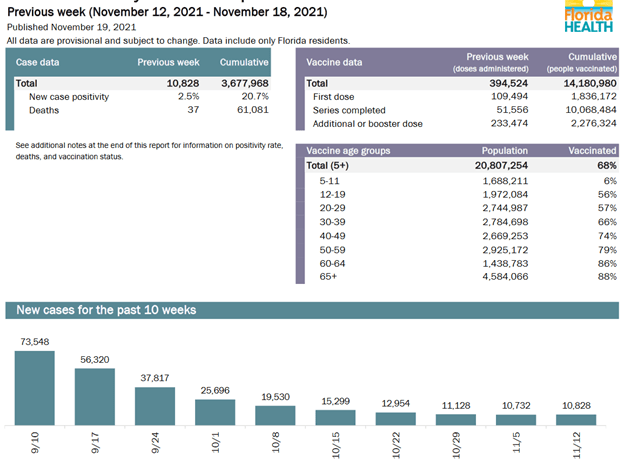
Here is some of the data from November 12–18, 2021:
- New cases = 10,828; Cumulative cases = 3,677,968
- New deaths = 37; Cumulative deaths = 61,081
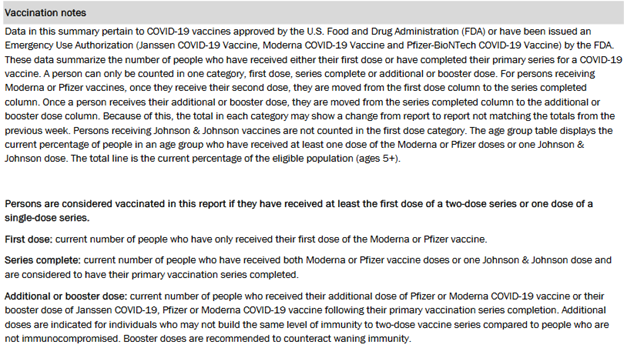
- Vaccination rate = 68%
- Fully vaccinated people minus those with booster shots = 10,068,484
- Total booster doses: 2,276,324
Salemi USF: COVID-19 in Florida
The vaccination rate reported by the state rose from 67% to 68%. This figure represents only those eligible for vaccination and includes partially vaccinated people. Florida’s population is currently 21,975,117, so 56.2% have at least completed a vaccination series. People who receive a booster shot are removed from the Series Completed Category and added to the Additional Dose Category.
It looks like the missing 1,103,491 people who completed the primary series from last week’s report have been restored to the state database.
Note that archived data on influenza statistics is readily available on the FL Dept of Health web site: Florida Influenza Surveillance Reports 2003–2021
This data from November 5–11, 2021, came from Dr. Salemi’s archives. Since October 14th, my browser will not download the FL Dept of Health Weekly Report, citing it as a security risk. Nevertheless, you would not find any archived Covid information on the FL Dept of Health site:
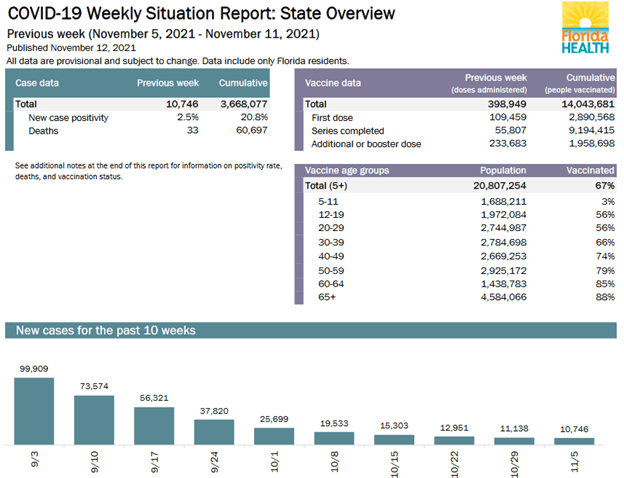
- New cases = 10,746; Cumulative cases = 3,668,077
- New deaths = 33; Cumulative deaths = 60,697
- Vaccination rate = 67%
- Fully vaccinated people minus those with booster shots = 9,194,415
- Total booster doses: 1,958,698
Salemi USF: COVID-19 in Florida
November 11, 2021 Florida Statistics: What is Really Happening?
.
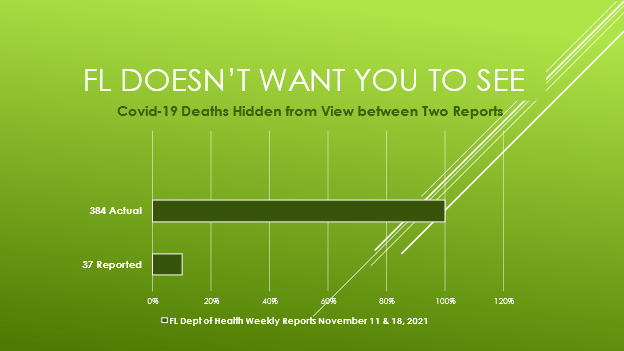
Covid Deaths in Florida:
Despite making national news for the state government’s attempt to cover up the number of deaths, nothing has changed in the Florida Department of Health’s methodology.
The Hill: Florida Reported ‘Artificial Decline’ in COVID-19 Deaths as Cases Were Surging
Subtracting the November 18th New Deaths from the Cumulative Deaths should give us the number of November 11th Cumulative Deaths. However, doing that reveals 347 deaths which were not included in the November 18th New Deaths. There was a total of 384 deaths reported in Florida during that week. Yet only 10% of deaths (37) are reflected clearly on the November 18th report. This is a 6% increase from last week (363).
Salemi USF: COVID-19 in Florida
November 11, 2021 Florida Statistics: What is Really Happening?
When the state receives a report of a death from a previous week, that information is added to “Cumulative Deaths” without being noted in “Previous Week Deaths.” It usually takes more than one week for death reports to get sent to the state.
Unless someone knows to compare the two data sets from both weeks, that is not apparent. By removing data from November 11th and adding data from November 18th simultaneously, only people who have saved the older data can see what they are doing. It looks like the death rate is 90% better than it is.
Florida Politics: Florida Reports 1000+ Covid-19 Deaths in Past Week
On June 4th, the state removed all data from anyone who has not established permanent residency and stopped reporting information from visitors, seasonal residents, and migrant workers. This deleted 744 deaths. I can no longer access this file, as my browser deems it a security risk:
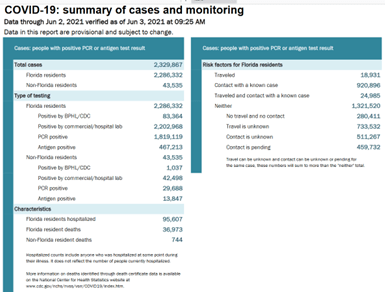
FL Covid-19 Cases and Monitoring as of June 3, 2021
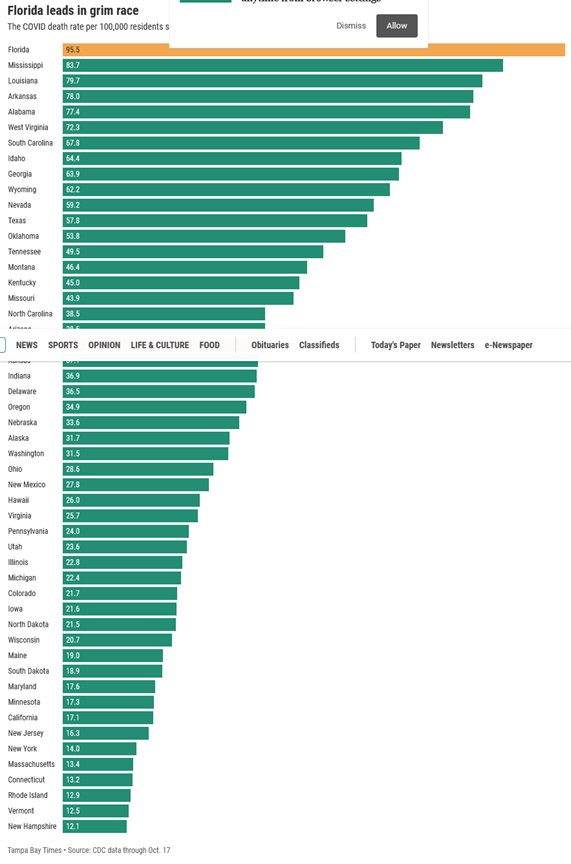
Florida began withholding previously available information from our state’s residents on June 5, 2021. An analysis by the Tampa Bay Times using CDC data with June 5th as a start date through October 17th indicates that Florida had the worst Covid death rate in the US.
TBT: Why Doesn‘t Florida Trust Its Residents with Basic COVID Information?
Over the course of the pandemic, Florida has one of the worst death rates in the nation (284/100,000 people):
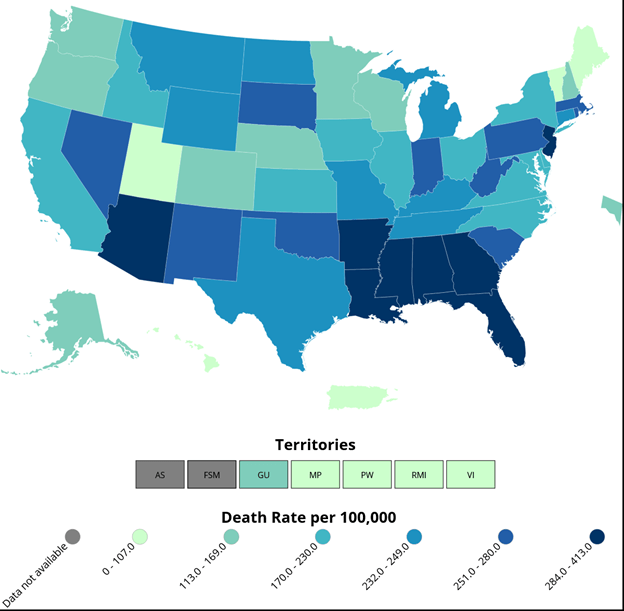
CDC: United States COVID-19 Cases, Deaths, and Laboratory Testing by State and Territory
Since August 1st, 20,588 permanent residents of Florida have died from Covid-19. All FL residents at least sixteen years old became eligible for vaccination on April 1st. SARS-CoV-2 infections have killed 26,657 permanent residents of the state since that date to November 18th. Despite having only 6.6% of the US population, this represents 12.6% of all American Covid-19 deaths since everyone at least 16 years old qualified for vaccination.
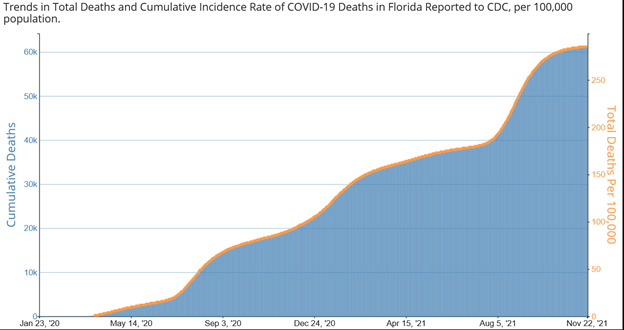
Trends in Number of COVID-19 Cases and Deaths in the US Reported to CDC, by State
Almost 1% of Floridians at least 65 years old have died due to Covid-19 (995.2/100,000). Sadly, we are likely to cross that threshold this week.
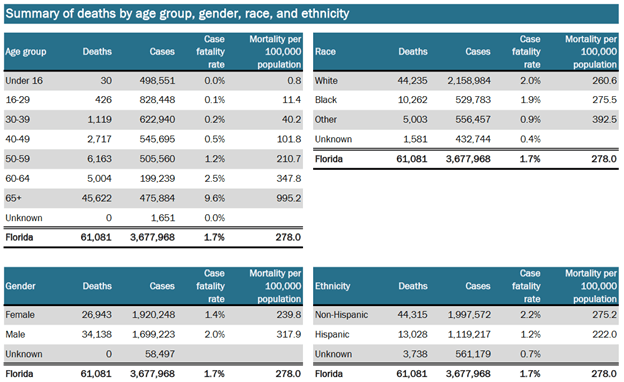
Salemi USF: COVID-19 in Florida
A comparison of Covid deaths in the six largest US states by September 29th reveals that Florida had the highest proportion when all Americans at least 16 years old were eligible for vaccination:
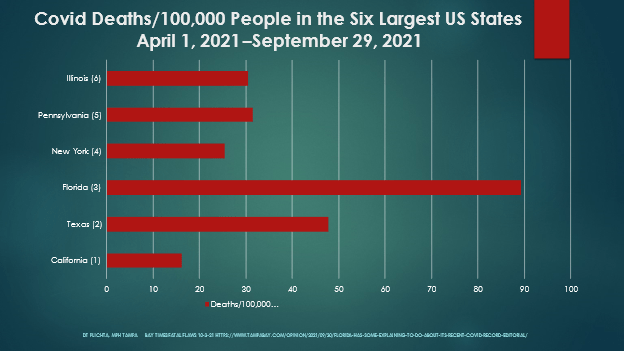
.
Covid Cases in Florida:
On the November 18th report, Florida reported 3,677,968 cumulative cases. Of those, 10,828 were new, a 0.8% increase from the prior week (10,746). Subtracting the new number from the cumulative one should give us the cumulative number from the previous week: 3,667,140.
However, the November 11th report shows a cumulative number of 3,668,077. This week, the state is over-reporting 937 cases, roughly making up for the under-reporting of the last two weeks (965 cases combined).
Salemi USF: COVID-19 in Florida
November 11, 2021 Florida Statistics: What is Really Happening?
November 4, 2021 Florida Statistics: What is Really Happening?
On June 4th, the state removed all data from anyone who is not a permanent resident and stopped reporting it. This deleted 43,535 cases.
FL Covid-19 Cases and Monitoring as of June 3, 2021
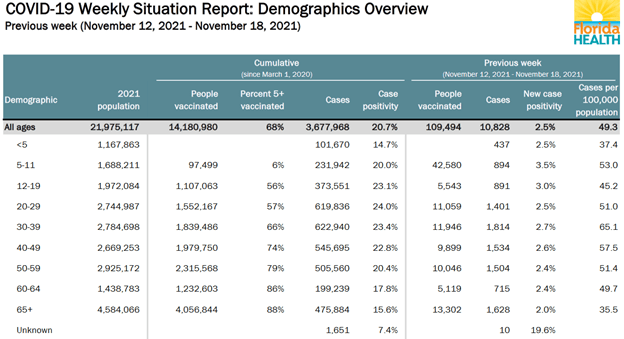
During the week of November 11–18, 1,331 children under twelve tested positive in Florida, a decrease of 8% over the previous week (1,444). Among those 12–19, 891 tested positive, a decrease of 6% from the prior week (952). In total, 2,222 Florida residents under the age of twenty tested positive, a decrease of 7%. The CDC recommended vaccination for children aged 5–11 on November 2nd. Currently, they have the highest positivity rate in Florida.
Salemi USF: COVID-19 in Florida
November 11, 2021 Florida Statistics: What is Really Happening?
In the Hillsborough County School District, only 46 cases were reported during November 11–18, 0.4% of the 11,850 cases during this school year. Nine weeks ago, the rate of increase was 87%. The school year began on August 10th, and the district instituted a mandatory mask mandate on August 18th. They ended it on October 15th.
HCSD: Covid FrequentlyAsked Questions
My daughters’ high school has had 70 cases, with none in the past nine weeks. During August 28th–September 2nd, the increase from the prior week was 87%. Our elementary school has had 60 cases, the same as the last three weeks.
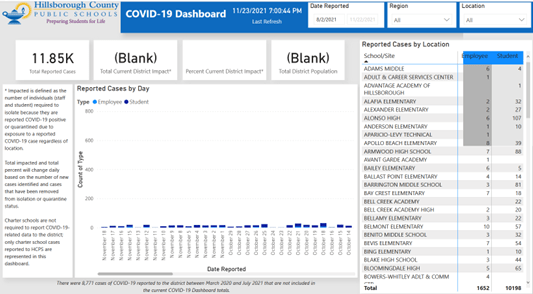
Hillsborough County Public Schools Covid Dashboard
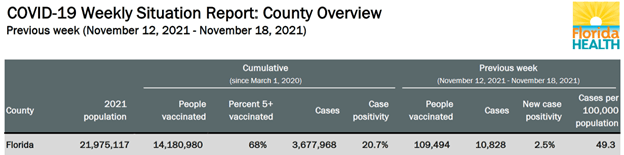
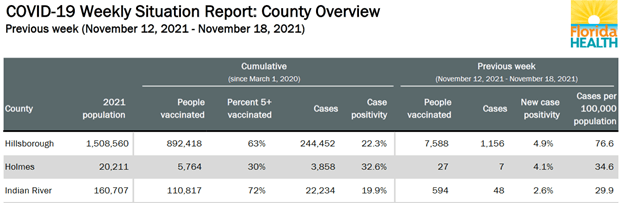
Here are a few of the FL Dept of Health county positivity rates. Hillsborough County has the third worst positivity rate in the state:
Salemi USF: COVID-19 in Florida
Dr. Jason Salemi, a professor from the University of South Florida, has been compiling data from the state since May 28th. His county-level data are quite helpful. His data indicates that Hillsborough County experienced a worrisome 40% increase in cases during November 12–18, 2021:
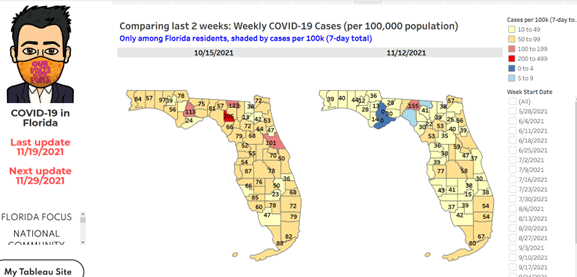
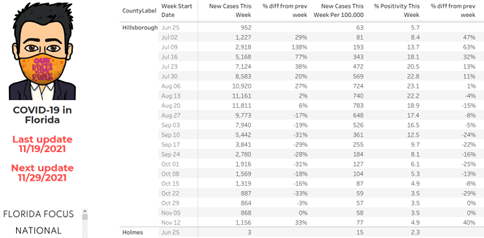
You can click on the maps for detailed information on each county. He also lists the data for each week since May 28, 2021, when Florida deleted its daily dashboard.
Salemi USF: COVID-19 in Florida
The CDC notes a 23% increase in Hillsborough County cases in the seven days prior to November 23rd.

CDC: COVID-19 Integrated County View, Hillsborough County FL
.
Covid Hospitalizations in Florida:
You won’t find any hospitalization information on Florida’s Weekly Surveillance Reports. Florida stopped reporting Covid hospitalizations on June 24, 2021. However, Florida must relay all hospitalization data to the US Department of Health and Human Services (HHS).
Florida reported a record 13,028 hospitalizations for Covid-19 on August 24, 2021, to the US Department of Health and Human Services.
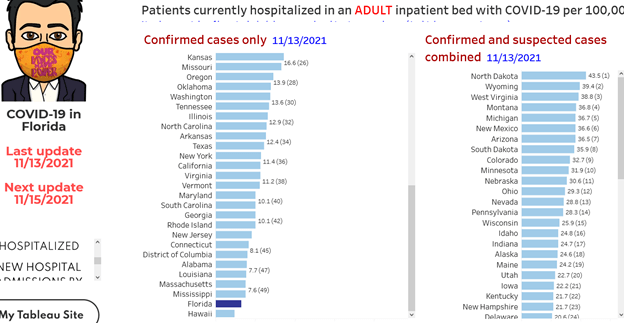
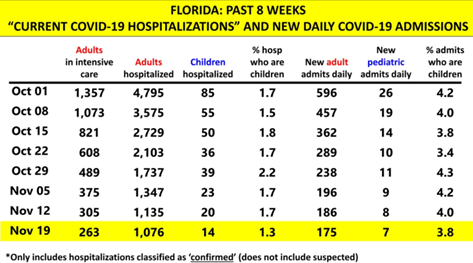
Nine weeks ago, Florida had the highest adult hospitalization rate in the US. Over the past few weeks, Florida improved from the fourth best hospitalization rate for adults in the nation to the second best on November 13th (from 7.4 to 6.5/100,000). This has not been updated this week.
Florida’s pediatric hospitalization rate dropped from 31st worst on November 8th to 37th on November 13th (0.54 to 0.45/100,000). This has not been updated in the past week.
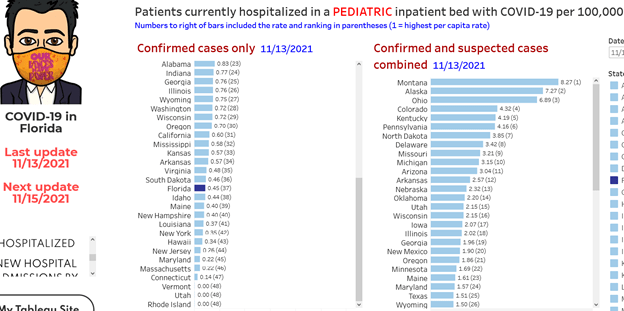
Changes in the school masking and quarantine policies enacted by the new FL Surgeon General on September 22, 2021, may account for the discrepancy in adult vs. pediatric hospitalization rankings. This makes it harder for counties to enforce mandatory mask wearing and allows the parents of children exposed to SARS-CoV-2 to determine whether their children should quarantine or return to school.
Salemi USF: COVID-19 Currently Hospitalized in Florida
TBT 9-30-21: Florida’s School Mask, Quarantine Rules Draw More Criticism
For August 1, 2020–November 18, 2021, Florida had 315,096 new admissions for Covid patients. This represents 9.4% of all Covid admissions in the US for 6.6% of the US population.
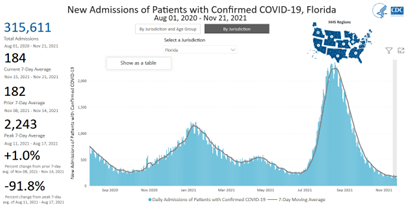
You can also find hospitalization statistics on the same CDC COVID Data Tracker, choosing Florida as the Jurisdiction and stratifying by any age:
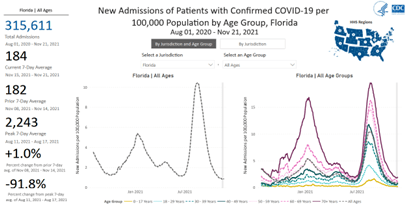
The daily average during November 12–18, 2021 was 188 new admissions. This represents a decrease of 4% in the past week (from 196) and of 92% from the peak during August 11–17, when there were 10.42 admissions/100,000 Floridians. In general, hospitalizations increased among younger people (18–39) and decreased substantially for older people (60+). The rate for ages 0–17 and 50–59 remained the same, while dropping slightly for ages 40–49.
On November 18th, there were 0.84 new admissions/100,000 Floridians; 0.92 the week before:
| Age | Admissions |
| 0–17 | 0.17 |
| 18–29 | 0.46 |
| 30–39 | 0.60 |
| 40–49 | 0.57 |
| 50–59 | 1.00 |
| 60–69 | 1.18 |
| 70+ | 1.76 |
| all ages | 0.84 |
The number of people in the hospital is now steadily dropping. One-fourth of hospitalized adults are in the ICU (24%).
Salemi USF: COVID-19 in Florida Hospital Admissions by Age
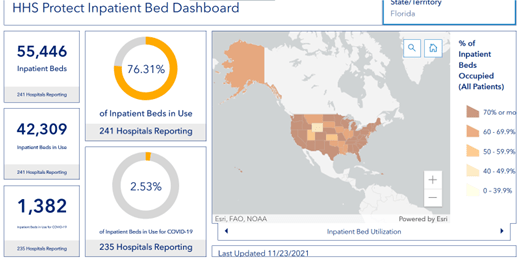
HHS tracks Hospital Utilization. On November 23, 2021, 76% of hospital beds in Florida were full, down 2% from last week. The 1,382 Covid patients still accounted for 3% of utilized beds. However, last week, there were 1,469 hospitalized Covid patients, a decrease of 6%. Two weeks ago, it dropped 35%.
Three percent of ICU beds in use in Florida were occupied by 260 Covid patients. That is down from 6% the previous week (319). State-wide, 59 fewer ICU beds were occupied, down 18%:
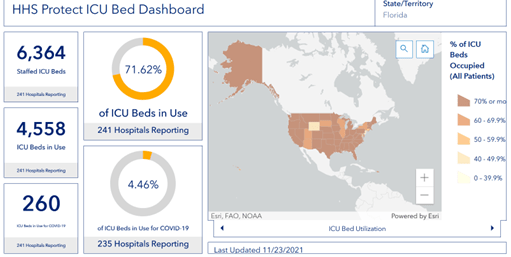
HHS: Inpatient Bed Utilization by State
Many hospitals are publishing their own occupancy statistics. For example, Tampa General Hospital released this on November 13th:
- There were 14 Covid-19 admissions, down from 21 ten days before
- Four Covid patients were in their ICU, down from 5 a week before
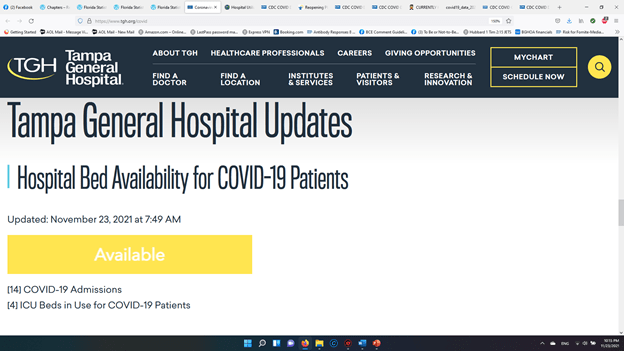
Tampa General : Hospital Bed Availability for COVID-19 Patients
For the first week since August 20th, the number of Covid-19 cases rose in Florida. While the state overall had a 1% increase, Hillsborough County reported an increase of 24% new cases in the past 7 days. The county experienced a 40% increase a week earlier.
The number of people whose deaths were reported last week due to Covid-19 rose by 6% during November 11–18, 2021. However, the state is continuing to claim only 10% of Covid-19 deaths reported for permanent residents of Florida during the past week as “New Deaths.”
Throughout the course of the pandemic, 9% of all hospitalizations in the US have been within the state. The current daily hospital admission rate for the entire US is approximately twice what Florida’s was in August. Changes in the school masking and quarantine policies enacted by the new FL Surgeon General on September 22, 2021, may account for the discrepancy in adult vs. pediatric hospitalization rankings.
Between April 1st and November 11th of this year—when vaccinations were available to all Floridians over the age of 16—12.6% of all Covid-19 deaths have occurred in Florida, a state with 6.6% of the population. Since the state began withholding information on June 5, 2021, Florida has had the worst Covid death rate in the nation. Unless the death rate declines dramatically, this week the state will reach the horrifying statistic of 1 Covid-19 death for every 100 senior citizens who are permanent residents of Florida.
Archived posts on Florida Covid statistics are available here:
